What You Will Find Here

My photo
Articles and news of general interest about investing, saving, personal finance, retirement, insurance, saving on taxes, college funding, financial literacy, estate planning, consumer education, long term care, financial services, help for seniors and business owners.

READING LIST

Blog List

Showing posts with label dividends. Show all posts

2016 Tax Changes (Wall Street Journal)


By 
LAURA SAUNDERS
January 8, 2016

A new year usually brings tax changes, and 2016 is no exception.
The good news is that last month, in the nick of time, Congress enacted permanent extensions of several popular provisions, including the American Opportunity tax credit, a higher-education benefit; the IRA charitable transfer provision for people 70 1/2 and older; certain mass-transit benefits; a child tax credit; and the ability to deduct state sales taxes instead of income tax on the federal return.
No longer will people using these benefits have to bite their nails waiting for lawmakers to re-enact them—especially if a provision has already expired, as happened several times over the past decade.
Here are other changes to be aware of:
Affordable Care Act penalty tax. For people who don’t have ACA-approved health insurance, the payment is rising steeply once again. Such taxpayers often owe a “shared responsibility payment” that is either a flat assessment or a percentage of income, whichever is higher. Roberton Williams, a tax specialist with the Tax Policy Center in Washington, says the percentage method will apply to virtually all higher-income households and even many single filers earning above $40,000.
In 2016, the flat assessment more than doubles. It is now $695 per individual, up from $325 last year, with a maximum of $2,085 per household. The percentage-of-income payment rises to 2.5% of income from 2% last year, with a projected maximum of about $13,400 per household.
Members of some groups aren’t subject to the payment, including certain religious groups and people covered by Medicare or Medicaid. The Tax Policy Center has posted anACA penalty calculator on its website.

Tax rates haven’t changed for 2016, but brackets have reset upward because of inflation indexing. 
Tax brackets. Because the U.S. tax code is progressive, higher income is taxed at higher rates—after deductions, exclusions and other adjustments. Tax rates haven’t changed for 2016, but brackets have reset upward due to inflation indexing. The top statutory rate of 39.6% now kicks in above $466,950 of taxable income for married couples filing jointly and $415,050 for singles.
“It’s good to know your top bracket, because it lets you estimate the value of a deduction,” says Greg Rosica, a partner with the accounting firm EY. In other words, $100 of a write-off could save as much as $28 of tax for someone in the 28% bracket.
A glance at the tax tables also serves as a reminder of the code’s unequal treatment of married couples versus single people who are above the 15% bracket. This anomaly raises tax bills substantially for some couples, especially if both partners have similar incomes, and lowers them for others. To find out if you are affected, see the Tax Policy Center’s marriage tax calculator.
Investments. The favorable rates on long-term capital gains (for investments held longer than a year) and certain dividends also haven’t changed for 2016, but inflation adjustments have lifted the brackets.
This year the 0% rate, which applies to both types of income, ends at $37,650 of taxable income for single filers and $75,300 for couples. Meanwhile, the top rate of 20% kicks in at $415,051 for single filers and $466,951 for couples.
In addition, some investors owe a 3.8% surtax on their net investment income. The threshold is $250,000 of adjusted gross income for married couples and $200,000 for singles.
This levy can cast a wider net than it appears to at first glance. That is because a taxpayer’s adjusted gross income is often much larger than taxable income, as it excludes Schedule A write-offs such as for mortgage interest, state taxes and charitable gifts. In addition, the thresholds aren’t indexed for inflation, so more investors could owe this surtax in 2016.
Mileage deductions. Lower gas prices are a boon, but they translate to lower mileage deductions on tax returns. For 2016, the business rate is 54 cents per mile driven versus 57.5 cents per mile last year.
The write-off per mile driven in the service of a charitable group is 14 cents this year, and the rate per mile driven for moving or medical purposes is 19 cents. Be sure to keep records to document these deductions.
Estate and gift tax. For 2016, the estate and gift tax exemption rises to $5.45 million per individual, up slightly from the 2015 level. This means the exemption per couple is now nearly $11 million, and only some 4,400 people will owe this tax for 2015, according to estimates by the Tax Policy Center.
The annual gift exclusion of $14,000 isn’t changing for 2016. This provision allows a giver to make tax-free transfers of up to $14,000 a year to each recipient, and one partner of a married couple can transfer up to $28,000 per recipient if the other spouse doesn’t use the break.
Corrections & Amplifications: 
The 28% tax bracket for single filers begins at $91,151. An earlier version of the chart accompanying this article incorrectly gave the figure as $90,151. (Jan. 8)
Write to Laura Saunders at laura.saunders@wsj.com

Preferred Stocks Frequently Asked Questions (from Incapital.com)

Preferred Security FAQs


HOW DO I PURCHASE PREFERRED SECURITIES?

After syndication, most public preferred securities are traded on an exchange.  The most widely used is the New York Stock Exchange.  They also trade over-the-counter through broker-dealers who make markets in various preferreds.  Privately-placed preferreds trade through a broker-dealer or directly between investors.

WHAT ARE CUMULATIVE AND NON-CUMULATIVE DIVIDENDS?

Preferred stock dividends are either cumulative or non-cumulative.  Cumulative dividends are due to shareholders irrespective of an issuer’s profitability.  If an issuer has trouble meeting its financial obligations and does not pay a cumulative dividend, dividends accrue and the company is obligated to pay all past and currently due preferred dividends before paying common dividends.  If a company does not pay a non-cumulative dividend, it is not obligated to do so in the future.  Non-cumulative dividends do not accrue beyond one year and the issuer is still permitted to pay common dividends the year following an omission if preferred payments recommence.  In either case, a company is not automatically considered in default if it misses a payment as it would be by missing a bond payment. 

ARE PREFERRED SECURITIES CALLABLE?

Preferred securities may be callable, in which case the issuer has the right to purchase the securities from the investor at a predetermined date and price.

IS THE INCOME FROM PREFERRED SECURITIES TAXABLE?

Income from preferreds with the exception of Trust Preferreds is taxable as ordinary income unless it is Qualified Dividend Income (QDI) and/or Dividend Received Deduction (DRD) eligible.  QDI and DRD eligibility depends on factors relating to the structure, issuer and investor.
Income from Trust Preferreds and Baby Bonds is considered interest and taxable as ordinary income.
The tax treatment of preferred securities varies.  However, investors should not rely on these taxation provisions, as they may change.  Incapital does not provide tax or financial advice.  Please read the tax section of the prospectus and prospectus supplement and consult a qualified tax professional before investing.

WHERE DO PREFERRED SECURITIES STAND IN THE PRIORITY OF CLAIMS?

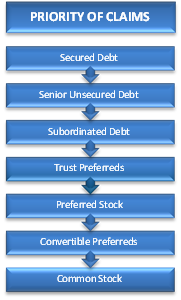
The priority of claims refers to the order in which investors receive their share of a firm’s net worth upon liquidation.  Preferred securities rank junior to bonds and senior to common stock in the priority of claims against a company’s assets in the event of bankruptcy or reorganization.  The diagram below illustrates the capital structure priority.  A preferred’s place may vary depending on its specific characteristics outlined in the prospectus and prospectus supplement.
Priority of Claims
This Priority of Claims diagram is for illustrative purposes only.  Each security’s offering documents will govern the issue’s priority.

WHERE CAN I GET A PROSPECTUS OR PROSPECTUS SUPPLEMENT?

The prospectus and prospectus supplement for public offerings are available on the SEC’s website.   

Dividend Aristocrats Yielding over 4 Percent (Marketwatch)

13 ‘Dividend Aristocrat’ stocks with yields over 4%

gPublished: Nov 25, 2015 3:42 p.m. ET
by Philip van Doorn; 415-439-6400; AskNewswires@dowjones.com40

These are investments to hold for the long run, regardless of rising official interest rates
AT&T is among the highest-yielding stocks included in the S&P High Yield Dividend Aristocrats Index.

The S&P 500 Dividend Aristocrats Index has greatly outperformed the broader S&P 500 Index over the past 10 years, and includes many quality companies that raise their payouts year after year. But S&P Dow Jones Indices has a High-Yield Dividend Aristocrats Index that can help you find even higher-yielding stocks.
Most financial-media news is geared toward current events that can affect stock prices over the short term. But many investors are much more concerned with longer-term strategies for growth or income.
For long-term growth investors — that is, those who truly wish to invest in companies for many years — we recently discussed an approach that considers some key performance numbers, but more importantly, factors in investors’ own belief of whether a company’s products or services will remain popular for decades.
But some investors are primarily concerned with income, which has shrunk as interest rates have fallen since 2008. The Federal Reserve is expected to begin raising the short-term federal funds rate soon, from a range of zero to 0.25%.
If interest rates start to rise, market prices of bonds and preferred stocks will fall. That is natural and expected by most income-seeking investors. It can be especially difficult for investors holding shares in bond mutual funds or other income funds because of their fluctuating share prices, which are based on the market values of the securities held by the funds. There’s no guarantee that your losses in a bond fund will ever be recovered.
But if you hold your own bonds or preferred stocks, you already know how much of a premium, if any, you paid when making the purchase, and therefore know how much you will lose (or gain, if you bought at a discount) when a bond matures or if a preferred stock is called. Holding your own paper can be wonderful because you not only keep all the interest or dividends being paid, you also don’t have to worry about market-price fluctuations.
Of course, this assumes your investment objective really is income, and that you are disciplined enough to keep holding the paper.
But at a time when interest rates around the world are so low, and when issuers are borrowing as much as possible to lock in low rates, the risk of a bond default appears to be growing, as Howard Gold described in great detail Wednesday.
Dividend Aristocrats
The S&P 500 Dividend Aristocrats Index SPDAUDP, +0.13% includes 52 companies among the S&P 500 SPX, +0.06% that have raised dividends each year for at least 25 years, according to S&P Dow Jones Indices.
“The index treats each constituent as a distinct investment opportunity without regard to its size by equally weighting each company,” according to S&P Dow Jones Indices.
Here’s how the Dividend Aristocrats Index has performed against the S&P 500 over the past 10 years:
FactSet
That’s big-time outperformance. Investors looking for long-term growth, who buy into the idea that a long track record of raising dividends implies strong overall performance, can “play” the Dividend Aristocrats via the ProShares S&P 500 Dividend Aristocrats ETF NOBL, +0.18% (Disclosure: I hold shares of NOBL.)
Here are the 10 highest-yielding S&P 500 Dividend Aristocrats:
CompanyTickerIndustryDividend yield
HCP Inc.HCP, +0.82%Real Estate Investment Trusts6.76%
AT&T Inc.T, +0.36%Major Telecommunications5.65%
Chevron Corp.CVX, -0.55%Integrated Oil4.70%
Consolidated Edison Inc.ED, +0.29%Electric Utilities4.16%
Emerson Electric Co.EMR, +0.10%Electrical Products3.90%
AbbVie Inc.ABBV, -0.48%Major Pharmaceuticals3.78%
Nucor Corp.NUE, +0.26%Steel3.68%
Exxon Mobil Corp.XOM, -0.02%Integrated Oil3.65%
Procter & Gamble Co.PG, -0.26%Household/Personal Care3.53%
Wal-Mart Stores Inc.WMT, -0.58%Discount Stores3.27%
Sources: S&P Dow Jones Indices, FactSet
A stock doesn’t need to have a very high yield to be included in the S&P 500 Dividend Aristocrats. The main idea is consistent dividend increases. Only four of those stocks have yields above 4%.
High-Yield Dividend Aristocrats
The S&P High-Yield Dividend Aristocrats SPHYDA, +0.24%  has more aggressive criteria, since it starts with the S&P 1500 Composite Index, which is made up of the S&P 500, the S&P Mid-Cap 400 Index MID, +0.32%  and the S&P 600 Small-Cap Index SML, +0.32% It includes 100 companies that have raised their dividends each year for at least 20 years (rather than 25 years for the S&P 500 Dividend Aristocrats).
The S&P High-Yield Dividend Aristocrats Index has underperformed the S&P 500 Dividend Aristocrats Index by quite a bit over the past 10 years:
FactSet
But the idea here is to produce a list of higher-yielding stocks of companies that love to raise dividends year after year.
Here are the 15 S&P High-Yield Dividend Aristocrats with the highest current yields:
CompanyTickerIndustryDividend yield
HCP Inc.HCP,+0.82%Real Estate Investment Trusts6.76%
AT&T Inc.T, +0.36%Major Telecommunications5.65%
Mercury General Corp.MCY,+0.76%Property/Casualty Insurance4.92%
Realty Income Corp.O, +1.24%Real Estate investment Trusts4.72%
National Retail Properties Inc.NNN,+0.99%Real Estate Investment Trusts4.70%
Chevron Corp.CVX, -0.55%Integrated Oil4.70%
Questar Corp.STR, +0.10%Gas Distributors4.57%
Caterpillar Inc.CAT, -0.38%Trucks/Construction/Farm Machinery4.44%
Consolidated Edison Inc.ED, +0.29%Electric Utilities4.16%
MDU Resources Group Inc.MDU,-0.62%Gas Distributors4.15%
Old Republic International Corp.ORI, -0.21%Property/Casualty Insurance4.05%
People’s United Financial Inc.PBCT,+0.12%Savings Banks4.05%
Black Hills Corp.BKH,+0.16%Electric Utilities4.02%
Vectren Corp.VVC, -0.07%Gas Distributors3.92%
Emerson Electric Corp.EMR,+0.10%Electrical Products3.90%
Sources: S&P Dow Jones Indices, FactSet
There’s plenty of overlap between the two lists, but now we have a list of 15 stocks, 13 of which have yields above 4%.
If you look at the industries of those companies, you may have some concern for Chevron Corp. CVX, -0.55%  and the three gas distributors because of the big decline in oil and natural gas prices over the past year and a half. Then again, the companies have ridden out several price disruptions over the past 20 years, and they have continued to raise dividends.
Caterpillar is another company you might be concerned about, since the decline in construction activity in China, along with the resulting drop in demand for copper and other commodities, have been very hard on the company.
Digging further
We cannot predict if any of the companies will cut their dividends, and their inclusion among the High-Yield Dividend Aristocrats speaks for itself.
But what we can do is compare the current yields with the companies’ free cash flow yields to consider how easily they’re covering dividends and the likelihood of further increases.
A company’s free cash flow is its remaining cash flow after capital expenditures. For real estate investment trusts, we are using funds from operations instead, because this is the generally accepted measurement of a REIT’s cash flow available for dividends.
We can then compare the companies’ free cash flow yields for the past 12 months to their current yields, to see if there is any “headroom.”
Here are free cash flow yields calculated by FactSet (except for the REITs, as described above) for the 15 highest-yielding High-Yield Dividend Aristocrats:
CompanyTickerFree cash flow yield - past 12 monthsDividend yield‘Headroom’
HCP Inc.HCP,+0.82%9.46%6.76%2.69%
AT&T Inc.T, +0.36%7.13%5.65%1.48%
Mercury General Corp.MCY,+0.76%6.26%4.92%1.34%
Realty Income Corp.O, +1.24%5.57%4.72%0.85%
National Retail Properties Inc.NNN,+0.99%6.03%4.70%1.32%
Chevron Corp.CVX,-0.55%-6.25%4.70%-10.95%
Questar Corp.STR,+0.10%2.94%4.57%-1.63%
Caterpillar Inc.CAT,-0.38%8.58%4.44%4.14%
Consolidated Edison Inc.ED,+0.29%2.56%4.16%-1.60%
MDU Resources Group Inc.MDU,-0.62%-6.32%4.15%-10.47%
Old Republic International Corp.ORI,-0.21%13.98%4.05%9.93%
People’s United Financial Inc.PBCT,+0.12%4.81%4.05%0.77%
Black Hills Corp.BKH,+0.16%-0.42%4.02%-4.44%
Vectren Corp.VVC,-0.07%1.63%3.92%-2.29%
Emerson Electric Corp.EMR,+0.10%7.66%3.90%3.76%
Sources: S&P Dow Jones Indices, FactSet
It’s important to keep in mind that this “backward-looking” comparison of cash flow yields and current dividend yields does not predict when cash flow will recover or whether dividends will go up or down. But it can give you additional insight into what effect temporary disruptions in markets really mean to a company.
You must also consider the direction of interest rates. REIT stock prices tend to slide, at least initially, when interest rates begin to rise. Are you really in it for the income? Can you afford to stay committed for many years, as the dividend income rolls in and hopefully rises? If so, REITs can be good investments for you, despite the inevitable seesawing price fluctuations.